
Understanding Our Powerful Snapshot Tool
The Snapshot Report is a powerful tool that allows you to get to the heart of your clients' online presence and reputation. To better speak to the report itself, it is useful to understand how our carefully tuned algorithm determines its grades.
Overall Score

The overall score is calculated by averaging the primary grades you've received in each section within the Snapshot Report. These grades are converted into numerical values:
- A = 4
- B = 3
- C = 2
- D = 1
- F = 0
The converted values are then summed and then divided by a perfect score (24). When a section is disabled, the overall score will adjust accordingly.
Example
In the above Snapshot Report, the score would be broken down as follows:

Once we have the total score, 11 in the above case, we then divide it by the perfect score of 24, giving us the overall score for the Snapshot Report.
11/24 = 0.458
This is then rounded to the nearest whole number. In the example provided, this would be the 46% shown in the screenshot.
Sections
For each section in the Snapshot Report, we use the following percentile grading system:
- A = 90 - 100th percentile
- B = 75 - 89th percentile
- C = 50 - 74th percentile
- D = 30 - 49th percentile
- F = 0 - 29th percentile
Listings
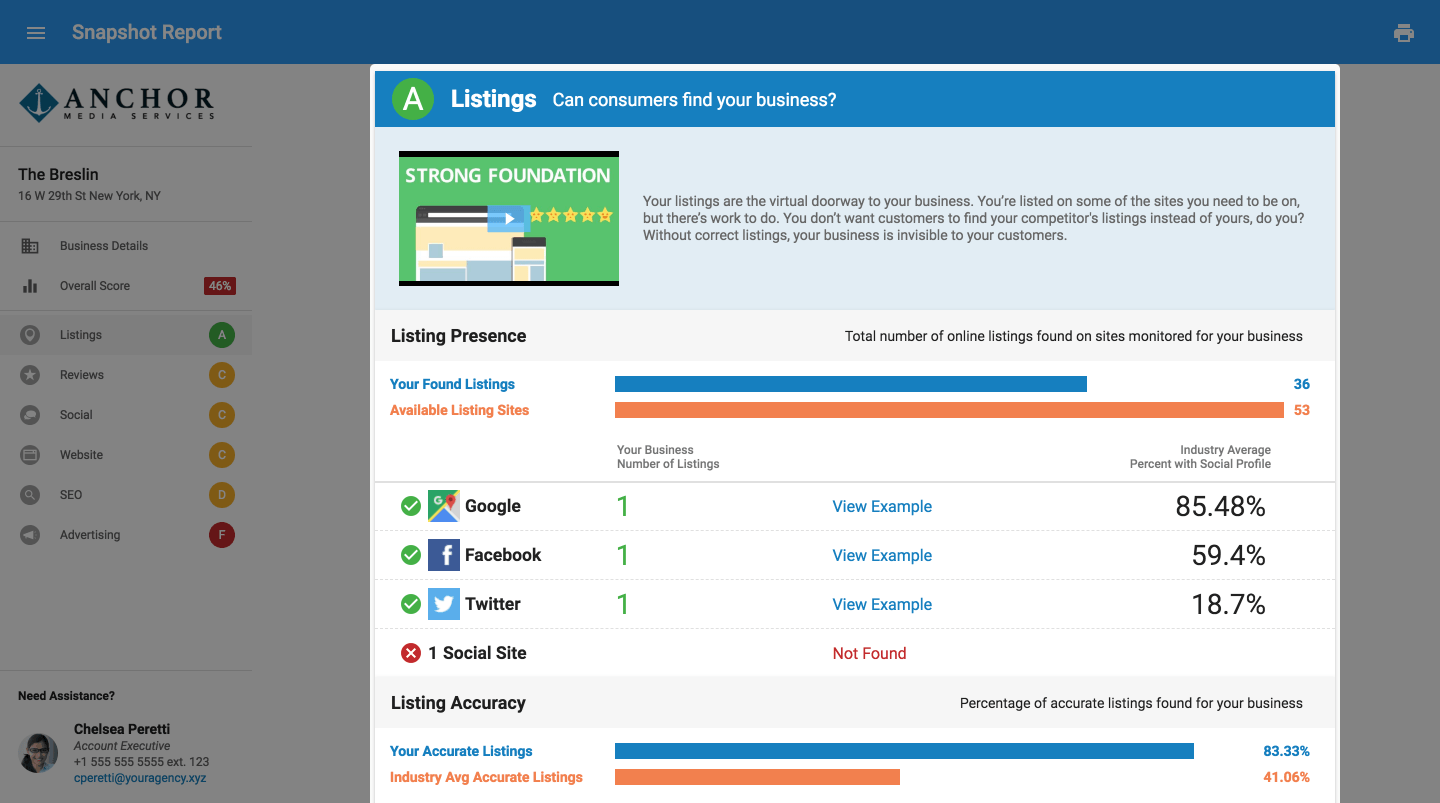
We calculate the prospect's Listing Score and then compare it to other businesses in their business category (using local business data from the VIV Platform).
Example: The business above has received a Listing Score of 635. The business is classified as a restaurant, thus comparing it to similarly classified businesses. As the formula prior to August 1st for scoring the Listings section considers anything within the top 20% of businesses to be an A, this section is graded as such.
You can view both the industry average and the 95th percentile's score in Reputation Management that is created alongside the Snapshot Report.
Reviews
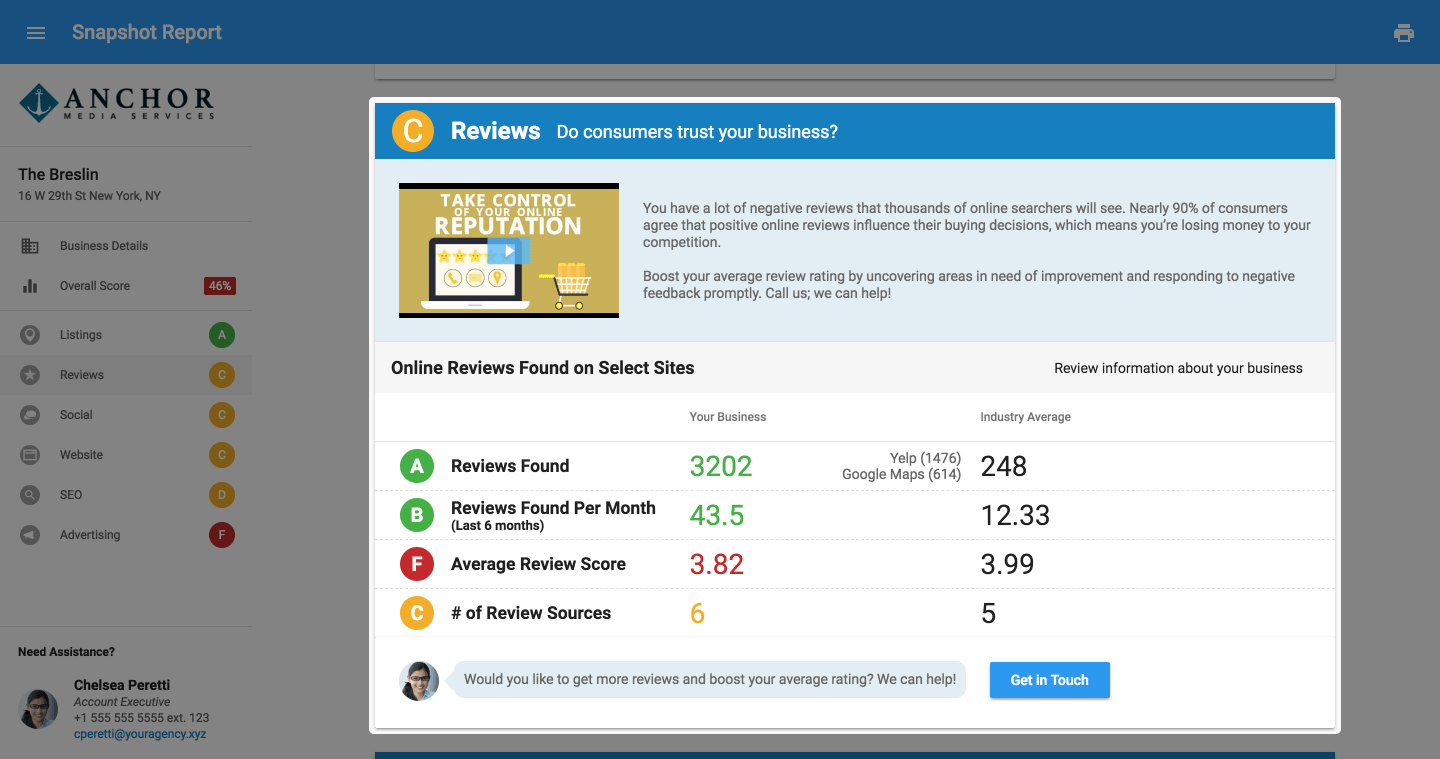
We first calculate the scores for each subsection contained under the Reviews heading. We then take those combined scores and divide them into the maximum possible score.
Example: The above business's grades are broken down as follows:
- Reviews Found | Top 10% = A
- Reviews Found Per Month | Top 25% = B
- Average Review Score | Bottom 29% = F
- # of Review Sources | Top 45% = C
If we convert these to point values, we have 4, 3, 0, and 2. Adding these together gives a total point value of 9. Since there are 4 sub-grades, we would divide this by 4 which gives us a score of 2.25, resulting in an overall grade of C.
Social
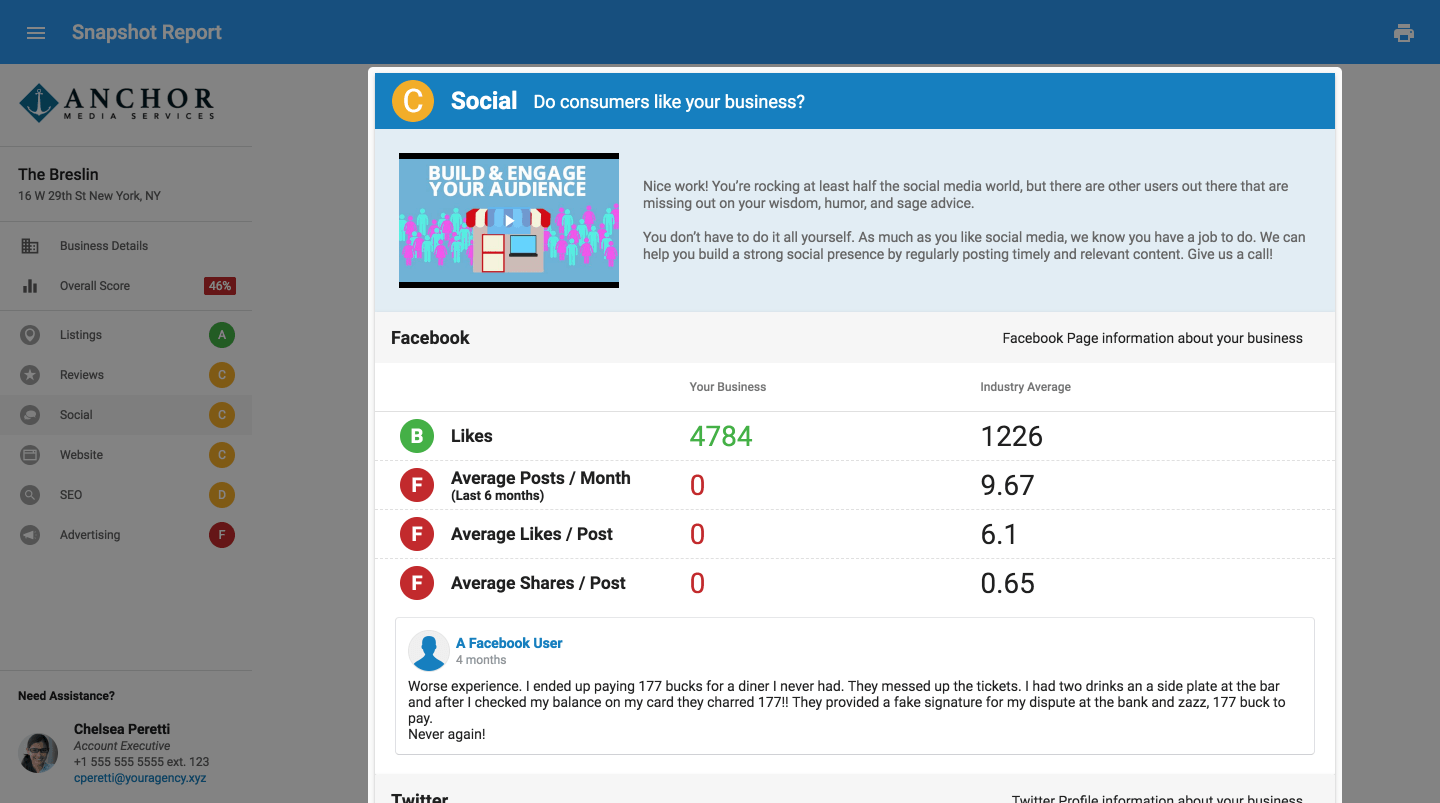
We first calculate the grades for each subsection under the Social heading. From there, we convert those scores to numerical values, then divide them by the total number of grades available.
Example: The above account has both Facebook and Twitter enabled on their Snapshot Report. Their subsections (Likes, Average Posts / Month, etc.) are calculated using the same method as other sections.
Facebook has ratings of B, F, F, and F. Converting these to numerical gives us 3, 0, 0, and 0:

Twitter has B, B, and B, which is equal to scores of 3, 3, and 3:

If we add these together, we get four ‘3’s and three ‘0’s. Adding these together gives us a value of 12. There are seven sub-grades enabled. If we break this down:
- Total Score / Number of Grades
- (3 + 0 + 0 + 0 + 3 + 3 + 3) / 7
- 12 / 7
- 1.7
We then round 1.7 up to 2. Using our grade conversion formula, 2 = C, thus making the overall Social grade a C.
Website
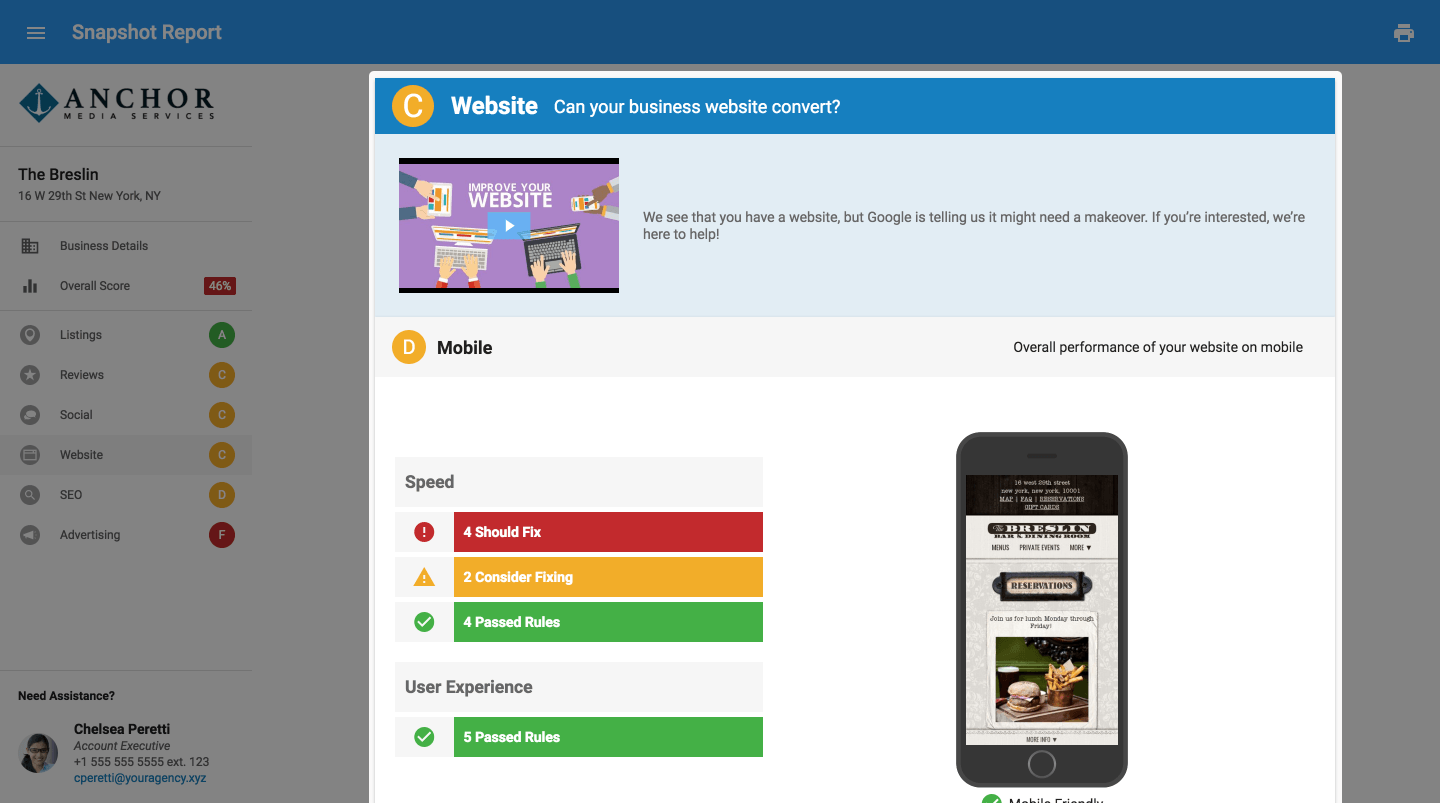
We use Google's PageSpeed Insights to analyze websites for the Snapshot Report. The Website section is comprised of three separate subsections. The grades from each of these are added together, then divided by the total number of grades available. We will break down these sections below.
Example: In the above report, the website has received the following grades:
- Mobile - D
- Desktop - F
- Homepage Content - A
These convert to scores of 1, 0, and 4 respectively. Adding these together, we get a total of 5. If we divide this by 3 (the number of sections available), we receive a value of 1.67. This is rounded up to 2, which gives us the total grade of C.
Mobile

Google's PageSpeed Insights scores both your speed and UX scores. We combine these scores, then compare the business to its industry percentiles to retrieve the Mobile grade.
Desktop

For the Desktop score, we take your Google PageSpeed Insights score (out of 100) and compare it to the industry percentiles.
Homepage Content

Each line within the Homepage Content subsection is given point values of either 0 (if the element is not detected) or 20 (if the element is detected. We add these scores together, then compare these to the industry percentiles.
Advertising & SEO
The SEO and Advertising sections are backed by a deep catalog of keywords. Every month, we run millions of searches for these keywords, then take the top 50 organic results and the top 2 pages of ads and save those to our database. From there, we use those results to calculate the following:
- Advertising: Estimated cost per click = Estimated monthly ad budget / Estimated monthly paid clicks
- SEO: Estimated value per click = Estimated monthly value of clicks / Estimated monthly clicks
It is important to stress that these are estimates and may not always accurately reflect the actual value of those clicks.


We're Helping Local Businesses Succeed. Let’s grow together.
Get in touch today!
Let us know about your marketing goals and one of our marketing specialists will be in contact with you!
Browse Our Packages
We've been lucky to work with over 2,100+ businesses. Check out some of our packages!
CONTACT US
We bring the team to the table to provide the best value for your business strategy. We're experts at collaborating the many different moving parts of digital marketing so that you can be the expert at running your business.
(812) 618-9498
10999 Stahl Rd, Newburgh, IN 47630
USEFUL LINKS
FOLLOW US
STAY INFORMED ON HOW TO GROW YOUR BUSINESS!
You need a helping hand with your project?
Evolv, Inc, doing business as Evolv is a registered Independent Sales Organization of Wells Fargo Bank N.A., Concord, CA and Fifth Third Bank, N.A., Cincinnati, OH
